Like it or not, but the good old days of achieving organic reach without any boosts are getting further and further away. Despite the existence of various marketing strategies nowadays, social media advertising is still one of the quickest and most effective ways to get you consistent sales and connect with your target audience.
To help you create and optimize your social ads, we’ve created the Social Media Ads tool, and today it got a smart new feature. Please meet the Performance Report.
What is it for?
The Performance Report is set to help advertisers in optimizing their social ad campaigns by highlighting in detail their weak and strong points. You will see a complete picture of troubled spots to be fixed, and the most effective growth points to be honed.
Charts
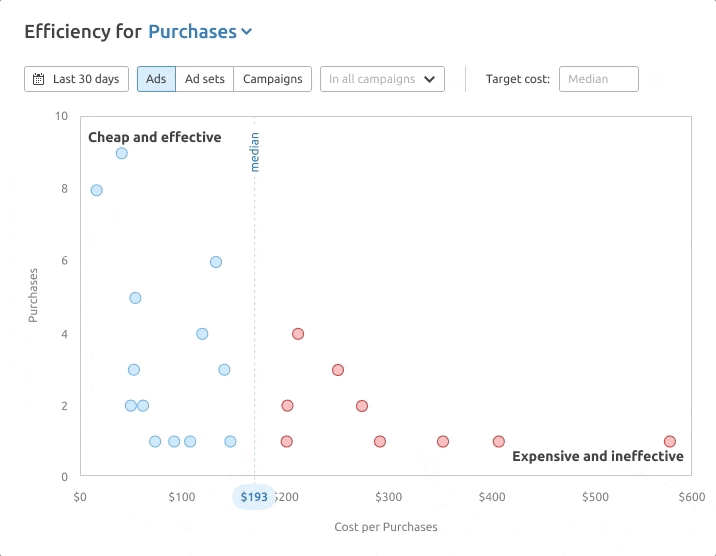
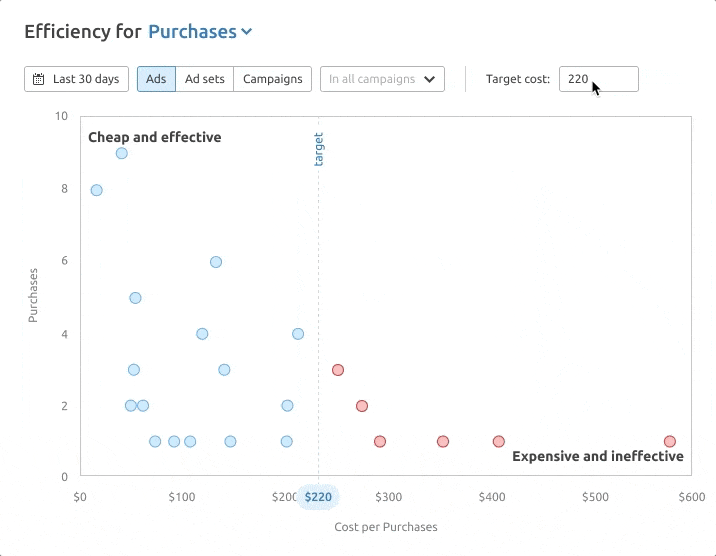
The first part contains the charts that give an overview of your ad account. You can see how each active ad, ad set, and the whole campaign perform: how many results they bring and how much each result costs.
Select any metric you’d like to consider as a result (Purchases, Trials, Link clicks, etc.).
For a more complete picture, there’s an option to enter your desired target cost (KPI) for each metric. By default, it is set to the median value of all ads that bring that result.
This visual representation makes it easy to spot weak points:
Ads that bring many and cheap results;
Ads that bring too few and expensive results;
Ads that don’t bring any results but have spent too much money already.
This will allow you to take further action on ads:
Scale high-performing ads (e.g. increase their budget);
Fix ineffective ads (e.g. change creative, change targeting, work on a landing page, or turn them off).
The report is intended to optimize the ads that are currently running, so it processes only your active ads.
Clicking on an ad will give more details on it. Such as:
If there are any specific performance issues highlighted by our tool;
Daily trend of the selected metric and money spent;
Additional metrics;
For campaigns: how active ad sets are performing in this campaign.
For ad sets and ads: how active ads are performing in this ad set.
You can also see the ad from the chart on the campaigns list to analyze it in the usual way (e.g. compare with other campaigns, add any additional metrics, etc.)
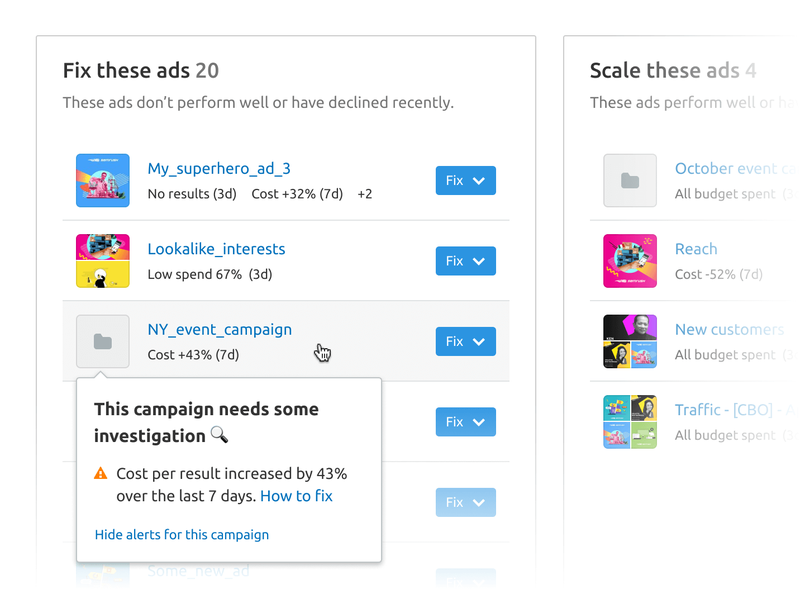
Ads That Need User’s Attention
The tool runs a number of performance checks on every active ad, ad set, and campaign.
All the ads, ad sets, and campaigns along with the issues found are displayed in two lists: good, possibly ready to improve; bad, possibly need to be fixed.
This handy feature allows you to see them all in one place, without the need to go to each campaign separately.
Ads in each list are sorted by importance, so the best- and the worst-performing ads are collected at the top of the corresponding lists.
In order to let you take action with these ads, each of them has a button with quick presets (e.g. Edit ad, Edit ad set, Turn off ad, etc.)
You can also see additional information about each ad, the same as from the charts.
We truly hope that this new report will help you increase your visibility and reach through social media. Any questions or suggestions? Feel free to send your feedback to smm-tool-feedback@semrush.com.
New analyst report recognizes Semrush’s competitive intelligence, robust analytics, and vision for SEO as the “engine of digital discoverability”
Product News
July 2, 2025
Optimize for AI Search with Site Audit
Semrush has introduced a brand-new AI Search category in the Site Audit tool, helping SEO professionals and web teams prepare their websites to be found and cited by AI search engines.
Product News
July 1, 2025
New AI Traffic Tool: Stay Ahead in the Era of AI-Powered Discovery
The Semrush Traffic & Market Toolkit just added a powerful new tool that gives digital marketers and analysts an unprecedented view into one of the most transformative shifts in online discovery: traffic driven by AI assistants. With the debut of the AI Traffic dashb...